
Class 12 : Grography (English) – Lesson 9.Population: Distribution, Density, Growth
EXPLANATION & SUMMARY
🔵 INTRODUCTION
Population is a key element in the study of human geography because people are the creators and users of resources. Population affects the economy, environment, resources, and the overall pattern of settlement. This lesson explains how population is distributed, how dense it is, how it grows, and how it is composed in terms of age, gender, occupation, etc.
🌿 Importance of Studying Population
✔️ Helps in understanding the relationship between population and resources.
✔️ Aids in planning for healthcare, education, employment, and infrastructure.
✏️ Note: Population patterns provide insight into developmental challenges and opportunities.
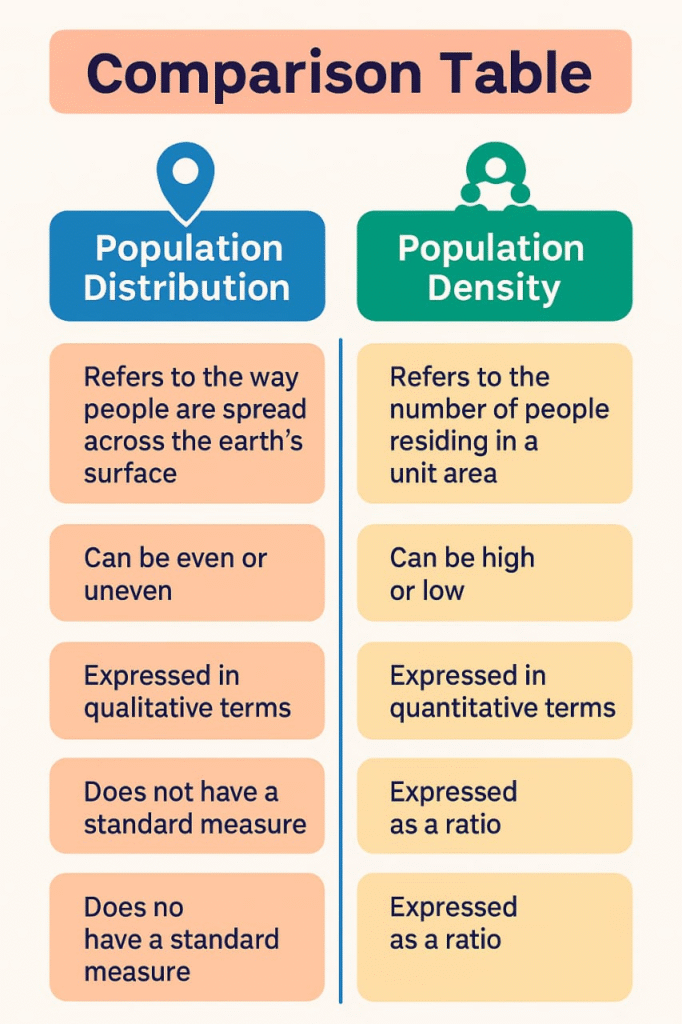
🟢 POPULATION DISTRIBUTION
Meaning
➡️ Population distribution refers to how people are spread over an area. It is uneven due to natural, historical, cultural, and economic factors.
Global Patterns
🔵 Areas of High Population Concentration:
East Asia
South Asia
Europe
North-eastern USA
🟢 Areas of Low Population Concentration:
Polar Regions (Antarctica, Arctic)
Deserts (Sahara, Thar)
Dense Forests (Amazon Basin)
Reasons for Uneven Distribution
✔️ Physical Factors: Climate, terrain, soil fertility, water availability.
✔️ Economic Factors: Industry, trade, employment opportunities.
✔️ Political and Historical Factors: Peace, stability, colonial history.
💡 Concept: Population tends to concentrate where living conditions and economic opportunities are favourable.
🔴 DENSITY OF POPULATION
Meaning
Population density is the number of people living per unit area (usually per square kilometre). It indicates pressure on land and resources.
Types of Density
🟡 Arithmetic Density: Population ÷ Total land area.
🟢 Physiological Density: Population ÷ Arable land area.
🔴 Agricultural Density: Agricultural population ÷ Arable land area.
World Patterns
High Density: Bangladesh, India, Japan, parts of Europe.
Low Density: Mongolia, Greenland, Namibia.
✏️ Note: High density doesn’t always mean overpopulation; it depends on resource management.
🟢 FACTORS INFLUENCING DISTRIBUTION AND DENSITY
Physical Factors:
✔️ Climate (Moderate is preferable)
✔️ Relief (Plains preferred over mountains)
✔️ Soil (Fertile areas attract populations)
✔️ Water (Rivers and lakes support settlements)
Economic Factors:
✔️ Industrial areas attract workers.
✔️ Developed regions offer better facilities.
Social & Political Factors:
✔️ Peaceful and politically stable regions attract population.
✔️ Migration policies influence distribution.
🌿 Conclusion: Population distribution is a result of both natural and human-made factors.
🔴 POPULATION GROWTH
Meaning
Population growth is the change in the number of people over time.
Types of Growth:
🟡 Natural Growth: Birth rate minus death rate.
🟢 Actual Growth: Natural growth plus migration.
Trends
Developing countries show rapid growth (high birth rate, falling death rate).
Developed countries show stable or declining populations.
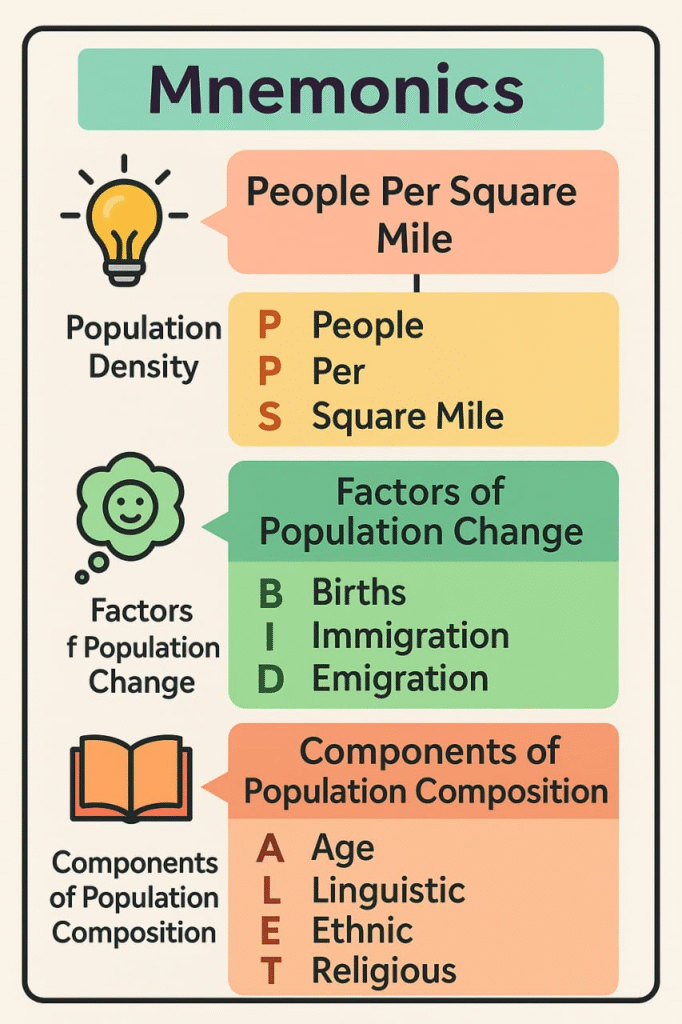
🟢 COMPONENTS OF POPULATION CHANGE
1️⃣ Birth Rate
Number of live births per 1000 people per year.
High in developing countries due to socio-economic reasons.
2️⃣ Death Rate
Number of deaths per 1000 people per year.
Declines with better healthcare and living standards.
3️⃣ Migration
➡️ Movement of people within or between countries.
✔️ Internal Migration (rural to urban)
✔️ International Migration (from one country to another)
✏️ Note: Migration influences population size and composition in both origin and destination.
🔴 DEMOGRAPHIC TRANSITION THEORY
Concept
Explains population change through stages of economic development.
Stages:
🔵 Stage 1 (High Stationary): High birth and death rates, slow growth.
🟢 Stage 2 (Early Expanding): Death rates fall, birth rates high, rapid growth.
🟡 Stage 3 (Late Expanding): Birth rates decline, death rates low, growth slows.
🔴 Stage 4 (Low Stationary): Low birth and death rates, population stabilises.
🌿 Conclusion: Transition reflects socio-economic development.
🔵 POPULATION COMPOSITION
Meaning
Refers to the structure of population in terms of age, sex, literacy, occupation, income, etc.
Age Structure:
Young Population (0–14 years)
Working Population (15–64 years)
Old Population (65+ years)
🌿 Countries with more youth focus on education and employment, while ageing nations need healthcare.
Sex Ratio:
Number of females per 1000 males.
Varies due to cultural, social, and migration factors.
Rural-Urban Composition:
Urban areas are centres of growth, innovation, and population concentration.
Rural areas are generally less dense but crucial for agriculture.
Literacy:
Affects population quality and development potential.
Occupational Structure:
✔️ Primary Activities: Agriculture, fishing.
✔️ Secondary Activities: Industry, manufacturing.
✔️ Tertiary Activities: Services, IT, education.
➡️ Developing countries have a larger primary sector; developed countries have more in services.
🔴 IMPLICATIONS OF POPULATION GROWTH
Positive Effects:
✔️ Large workforce
✔️ Economic growth potential
Negative Effects:
✔️ Pressure on natural resources
✔️ Unemployment
✔️ Environmental degradation
✔️ Need for infrastructure expansion
🌿 Planning is necessary to balance population and resources.
🟡 POPULATION POLICY AND CONTROL MEASURES
Measures:
✔️ Family planning
✔️ Education, especially women’s education
✔️ Incentives for small families
✔️ Healthcare improvements
🌿 Policies aim for sustainable population growth and resource management.
🔵 REAL-LIFE CONNECTION
Population studies help in:
✔️ Urban planning
✔️ Healthcare services
✔️ Education policy
✔️ Disaster management
✔️ Economic strategies
🟢 WHY THIS LESSON MATTERS
➡️ It links human activity to resource use and sustainability.
➡️ Informs policies on health, education, economy, and environment.
➡️ Helps understand global and regional inequalities and opportunities.
🌿 Human geography is incomplete without studying population dynamics.
📝 QUICK RECAP:
🔵 Distribution – Uneven; dense in Asia, sparse in deserts/poles
🟢 Density – People per area; varies by resources and development
🔴 Growth – Birth, death, migration; rapid in developing nations
🟡 Composition – Age, sex, literacy, occupation
⚡ Impacts – Economy, resources, environment
➡️ Policies – Education, family planning, healthcare
SUMMARY (300 WORDS)
🔵 Population: Distribution, Density, Growth and Composition
Population studies help understand how people are spread across the earth and how their numbers change over time.
🟢 Distribution:
Population is unevenly distributed due to physical, social, economic, and political factors. High concentrations exist in Asia, Europe, and North America. Sparse regions include deserts and polar areas.
🔴 Density:
Population density is measured as people per square kilometre. It is high in fertile plains and low in harsh terrains. Physiological and agricultural densities offer deeper insights.
🟡 Growth:
Population growth depends on birth rates, death rates, and migration. Developing countries show high growth due to high birth rates and declining death rates. Developed nations have stable or declining populations.
🔵 Components of Change:
Birth, death, and migration alter population size and composition. Migration affects both origin and destination areas.
🟢 Demographic Transition:
Societies move from high birth and death rates to low ones as they develop, passing through identifiable stages.
🔴 Composition:
Population composition includes age, sex, literacy, rural-urban divide, and occupation. These factors influence economic activities and policy decisions.
🟡 Implications:
Population growth affects employment, housing, health, education, and environment. Uncontrolled growth leads to resource strain.
🌿 Population Policy:
Education, healthcare, and family planning aim to stabilise growth for sustainable development.
Importance:
Understanding population patterns aids planning for infrastructure, economy, and welfare, making it a crucial area of human geography.
————————————————————————————————————————————————————————————————————————————
QUESTIONS FROM TEXTBOOK
QUESTION 1
Choose the right answers of the followings from the given options.
(i) India’s population as per 2011 census is:
(a) 1028 million
(b) 3182 million
(c) 3287 million
(d) 1210 million
ANSWER 1 (i)
➡️ Correct Answer: (d) 1210 million
🔵 As per the 2011 Census, India’s population was recorded as 1210 million.
QUESTION 1 (ii)
Which one of the following states has the highest density of population in India?
(a) West Bengal
(b) Kerala
(c) Uttar Pradesh
(d) Bihar
ANSWER 1 (ii)
➡️ Correct Answer: (d) Bihar
🟢 Bihar has the highest density of population due to fertile plains and high birth rates.
QUESTION 1 (iii)
Which one of the following states has the highest proportion of urban population in India according to 2011 Census?
(a) Tamil Nadu
(b) Maharashtra
(c) Kerala
(d) Goa
ANSWER 1 (iii)
➡️ Correct Answer: (b) Maharashtra
🟡 Maharashtra has the highest proportion of urban population owing to cities like Mumbai and Pune, which are major urban centres.
QUESTION 1 (iv)
Which one of the following is the largest linguistic group of India?
(a) Sino – Tibetan
(b) Indo – Aryan
(c) Austric
(d) Dravidian
ANSWER 1 (iv)
➡️ Correct Answer: (b) Indo – Aryan
🔴 Indo-Aryan languages are spoken by the largest proportion of India’s population.
QUESTION 2
Answer the following questions in about 30 words.
(i) Very hot and dry and very cold and wet regions of India have low density of population. In this light, explain the role of climate on the distribution of population.
ANSWER 2 (i)
🔵 Extreme climatic conditions such as very hot deserts or extremely cold mountains make human habitation difficult.
🟢 Harsh climates reduce agricultural productivity, limit resources, and discourage settlements, leading to low population density.
QUESTION 2 (ii)
Which states have large rural population in India? Give one reason for such large rural population.
ANSWER 2 (ii)
🟡 States like Uttar Pradesh, Bihar, and Madhya Pradesh have large rural populations.
✔️ These states depend heavily on agriculture, which requires a larger rural workforce and supports village-based livelihoods.
QUESTION 2 (iii)
Why do some states of India have higher rates of work participation than others?
ANSWER 2 (iii)
🔴 States with higher literacy rates, better industrialisation, and more developed services have higher work participation.
🟢 Economic opportunities encourage more people to join the workforce.
QUESTION 2 (iv)
‘The agricultural sector has the largest share of Indian workers.’ – Explain.
ANSWER 2 (iv)
🔵 A majority of India’s population lives in rural areas and depends on agriculture for livelihood.
🟢 Agriculture is labour-intensive and requires a large workforce, hence it engages the highest proportion of workers.
QUESTION 3
Answer the following questions in about 150 words.
(i) Discuss the spatial pattern of density of population in India.
ANSWER 3 (i)
🔵 High-Density Areas:
✔️ The Ganga Plains, parts of Kerala, and Maharashtra have high density due to fertile land, water availability, and urbanisation.
✔️ Urban centres like Delhi and Mumbai also contribute to dense population.
🟢 Moderate Density Areas:
✔️ Punjab, Haryana, and parts of Gujarat show moderate density because of developed agriculture and industries.
🟡 Low-Density Areas:
✔️ The Himalayan region, deserts of Rajasthan, and north-eastern states like Arunachal Pradesh have sparse populations due to harsh climate and difficult terrain.
🔴 Conclusion:
➡️ Population density in India reflects the interplay of physical, economic, social, and historical factors.
QUESTION 3 (ii)
Give an account of the occupational structure of India’s population.
ANSWER 3 (ii)
🔵 Primary Sector (Agriculture):
✔️ Engages the largest share of the workforce, especially in rural areas.
✔️ Involves farming, fishing, forestry.
🟢 Secondary Sector (Industry):
✔️ Involves manufacturing, construction, mining.
✔️ Employs fewer people compared to agriculture but growing with industrialisation.
🟡 Tertiary Sector (Services):
✔️ Includes trade, transport, banking, education, healthcare.
✔️ Increasingly significant in urban areas and developed regions.
🔴 Conclusion:
➡️ India’s occupational structure is gradually shifting from primary to secondary and tertiary sectors due to urbanisation and economic development.
————————————————————————————————————————————————————————————————————————————
OTHER IMPORTANT QUESTIONS FOR EXAMS
(CBSE MODEL QUESTIONS PAPER)
ESPECIALLY MADE FROM THIS LESSON ONLY
Q1. As per Census 2011, India’s total population was approximately:
(A) 1028 million
(B) 3182 million
(C) 1210 million
(D) 3287 million
Answer: (C) 1210 million
Q2. Which state has the highest population density as per 2011 Census?
(A) West Bengal
(B) Kerala
(C) Bihar
(D) Uttar Pradesh
Answer: (C) Bihar
Q3. Which of the following states has the largest proportion of urban population?
(A) Maharashtra
(B) Tamil Nadu
(C) Kerala
(D) Goa
Answer: (A) Maharashtra
Q4. The largest linguistic group in India is:
(A) Sino-Tibetan
(B) Indo-Aryan
(C) Dravidian
(D) Austric
Answer: (B) Indo-Aryan
Q5. Which one of the following is the most populated state in India?
(A) Rajasthan
(B) Uttar Pradesh
(C) Madhya Pradesh
(D) Maharashtra
Answer: (B) Uttar Pradesh
Q6. Which one of the following regions of India has low population density due to extreme climate?
(A) Ganga Plains
(B) Rajasthan Desert
(C) Coastal Andhra Pradesh
(D) Punjab
Answer: (B) Rajasthan Desert
Q7. Which is a major reason for high population density in the Northern Plains?
(A) Arid land
(B) Availability of water and fertile soil
(C) Dense forests
(D) Lack of infrastructure
Answer: (B) Availability of water and fertile soil
Q8. Which state among the following has high rural population?
(A) Kerala
(B) Bihar
(C) Goa
(D) Punjab
Answer: (B) Bihar
Q9. Which is the largest age group in India’s population structure?
(A) 0-14 years
(B) 15-59 years
(C) 60 years and above
(D) None of these
Answer: (B) 15-59 years
Q10. India’s population density (2011) is approximately:
(A) 382 persons per sq km
(B) 400 persons per sq km
(C) 500 persons per sq km
(D) 350 persons per sq km
Answer: (A) 382 persons per sq km
Q11. The sex ratio in India as per Census 2011 is:
(A) 940 females per 1000 males
(B) 950 females per 1000 males
(C) 960 females per 1000 males
(D) 970 females per 1000 males
Answer: (A) 940 females per 1000 males
Q12. Which is not a factor influencing population distribution in India?
(A) Climate
(B) Soil fertility
(C) Historical factors
(D) Oceans
Answer: (D) Oceans
Q13. Assertion (A): Bihar has the highest population density.
Reason (R): It has favourable climate and fertile plains.
Options:
(A) Both A and R are true, and R is the correct explanation of A.
(B) Both A and R are true, but R is not the correct explanation of A.
(C) A is true, but R is false.
(D) Both A and R are false.
Answer: (A) Both A and R are true, and R is the correct explanation of A.
Q14. Which is the largest occupational sector in India?
(A) Agriculture
(B) Manufacturing
(C) Mining
(D) Information Technology
Answer: (A) Agriculture
Q15. Which of the following states has higher work participation?
(A) Himachal Pradesh
(B) Kerala
(C) Punjab
(D) Haryana
Answer: (A) Himachal Pradesh
Q16. Migration affects population distribution by:
(A) Increasing urban population
(B) Decreasing rural population
(C) Both A and B
(D) None
Answer: (C) Both A and B
Q17. Which of these areas has sparse population due to topography?
(A) Ganga Plains
(B) Himalayan region
(C) Punjab
(D) Gujarat
Answer: (B) Himalayan region
Q18. Which of the following is not a linguistic group in India?
(A) Indo-Aryan
(B) Dravidian
(C) Austric
(D) Celtic
Answer: (D) Celtic
Q19. Define population density. Why does Bihar have high population density?
Answer:
🔵 Population density refers to the number of people living per unit area, usually per square kilometre.
🟢 Bihar has high population density due to fertile plains, availability of water, and traditional dependence on agriculture which supports a large rural population.
Q20. What is the significance of occupational structure in the population composition of India?
Answer:
🔵 Occupational structure shows the distribution of population among primary, secondary, and tertiary sectors.
🟢 In India, a large proportion is engaged in the primary sector, indicating rural dependence and the need for diversification towards industry and services.
Q21. Mention any two reasons for low population density in the Himalayan region.
Answer:
🔵 Harsh climate with extreme cold and heavy snowfall makes living conditions difficult.
🟢 Rugged and mountainous terrain restricts agriculture and transportation facilities.
Q22. What is the main reason for the high rural population in India? Name any two states with high rural population.
Answer:
🔵 India’s rural population is high due to agriculture being the main livelihood, requiring more people to stay near farmlands.
🟢 Two states with high rural population: Uttar Pradesh and Bihar.
Q23. Explain the impact of migration on the urban population of India.
Answer:
🔵 Migration from rural to urban areas increases urban population, leading to overcrowding, slums, and pressure on resources.
🟢 It also boosts the urban workforce, contributing to economic activities.
Q24. Explain any three factors affecting the distribution of population in India.
Answer:
🔵 Climate: Moderate climates attract more people than extreme climates.
🟢 Topography: Plains and river valleys support agriculture and settlements; mountains discourage population.
🟡 Economic Opportunities: Industrial regions and cities attract people for jobs and better living standards.
Q25. Describe the characteristics of states with high work participation rates.
Answer:
🔵 High work participation is seen in states with rural economies dependent on agriculture.
🟢 These states often lack industrialisation, so more people, including women, are involved in subsistence work.
🟡 Examples include Himachal Pradesh and Rajasthan.
Q26. Differentiate between rural and urban composition of India’s population.
Answer:
🔵 Rural Composition: Higher population engaged in agriculture, limited infrastructure, traditional lifestyles.
🟢 Urban Composition: Population involved in industries and services, better infrastructure, modern lifestyle.
🟡 Rural population is larger; urban population is growing rapidly.
Q27. Write any three consequences of uneven population distribution in India.
Answer:
🔵 Overcrowded areas face unemployment, pressure on land and infrastructure.
🟢 Sparsely populated areas remain underdeveloped due to lack of human resources.
🟡 Uneven distribution creates regional economic disparities.
Q28. Explain the significance of studying population composition in planning.
Answer:
🔵 Population composition reveals age groups, literacy, occupations, and sex ratio.
🟢 Helps in planning for education, healthcare, housing, and employment.
🟡 Supports targeted development policies for different regions.
Q29. Read the following passage and answer the questions below:
“India’s population distribution shows a concentration in certain regions like the Northern Plains and coastal areas, whereas deserts, mountains, and forests show sparse populations.”
(i) Name two regions with high population density. (1)
(ii) Mention one reason why deserts have low population density. (1)
(iii) State any two human factors influencing population distribution. (2)
ANSWER 29:
(i) Ganga Plains and Kerala coast.
(ii) Deserts lack water availability and have extreme climate.
(iii)
1️⃣ Availability of employment opportunities.
2️⃣ Urbanisation and infrastructure facilities.
Q30. Read the following passage and answer the questions below:
“The occupational structure of India’s population reveals a predominance of agricultural employment, but there are signs of increasing involvement in industrial and service sectors in urban areas.”
(i) Which sector employs the majority of India’s workforce? (1)
(ii) Name one area with a growing secondary sector workforce. (1)
(iii) Write any two reasons for growth in the tertiary sector. (2)
ANSWER 30:
(i) Primary sector (agriculture).
(ii) Maharashtra (urban centres like Mumbai).
(iii)
1️⃣ Growth of education, banking, healthcare.
2️⃣ Expansion of communication and transport services.
Q31. Read the passage and answer the questions:
“Work participation rates vary across India due to differences in literacy, urbanisation, and nature of economy.”
(i) Name any two states with high work participation. (1)
(ii) Mention one reason for high work participation in these states. (1)
(iii) Explain two impacts of high work participation on the economy. (2)
ANSWER 31:
(i) Himachal Pradesh, Rajasthan.
(ii) Dependence on agriculture and rural economy.
(iii)
1️⃣ Reduces unemployment.
2️⃣ Boosts productivity and local economy.
Q32. Explain the factors responsible for uneven distribution of population in India.
ANSWER 32:
🔵 Physical Factors:
1️⃣ Climate — Moderate climates support dense populations.
2️⃣ Soil — Fertile plains like Ganga basin attract people.
3️⃣ Water — Availability of rivers supports agriculture and settlements.
🟢 Economic Factors:
1️⃣ Industrial and trade centres offer jobs and better facilities.
2️⃣ Urbanisation attracts rural migrants.
🟡 Social & Political Factors:
1️⃣ Historical settlements and peace attract populations.
2️⃣ Infrastructure, education, and healthcare availability promote settlement.
➡️ Population concentration results from these combined factors.
Q33. Discuss the consequences of population growth and density in India.
ANSWER 33:
🔵 Economic Consequences:
1️⃣ Increased unemployment.
2️⃣ Overburdened resources.
🟢 Social Consequences:
1️⃣ Pressure on education and healthcare.
2️⃣ Housing shortages lead to slums.
🟡 Environmental Consequences:
1️⃣ Deforestation and land degradation.
2️⃣ Pollution increases with dense populations.
➡️ Controlled growth is necessary for sustainable development.
Q34. Explain the spatial pattern of population density in India.
ANSWER 34:
🔵 High-Density Areas:
1️⃣ Northern Plains (UP, Bihar) — fertile land, water availability.
2️⃣ Coastal regions — trade, urban centres.
🟢 Moderate Density Areas:
1️⃣ Gujarat, Punjab — agriculture, industry mix.
🟡 Low-Density Areas:
1️⃣ Himalayan region — tough terrain.
2️⃣ Rajasthan desert — arid climate.
➡️ Distribution reflects both natural and human factors.
Q35. Give an account of the occupational structure of India’s population.
ANSWER 35:
🔵 Primary Sector (Agriculture):
✔️ Largest share of employment, rural focus.
🟢 Secondary Sector (Industry):
✔️ Manufacturing, mining, construction; growing with industrialisation.
🟡 Tertiary Sector (Services):
✔️ Trade, transport, communication, education, banking.
✔️ Rapid growth in urban areas.
➡️ Trend shows gradual shift from primary to secondary and tertiary with development.
————————————————————————————————————————————————————————————————————————————
QUESTIONS FROM COMPETITION EXAMS
————————————————————————————————————————————————————————————————————————————
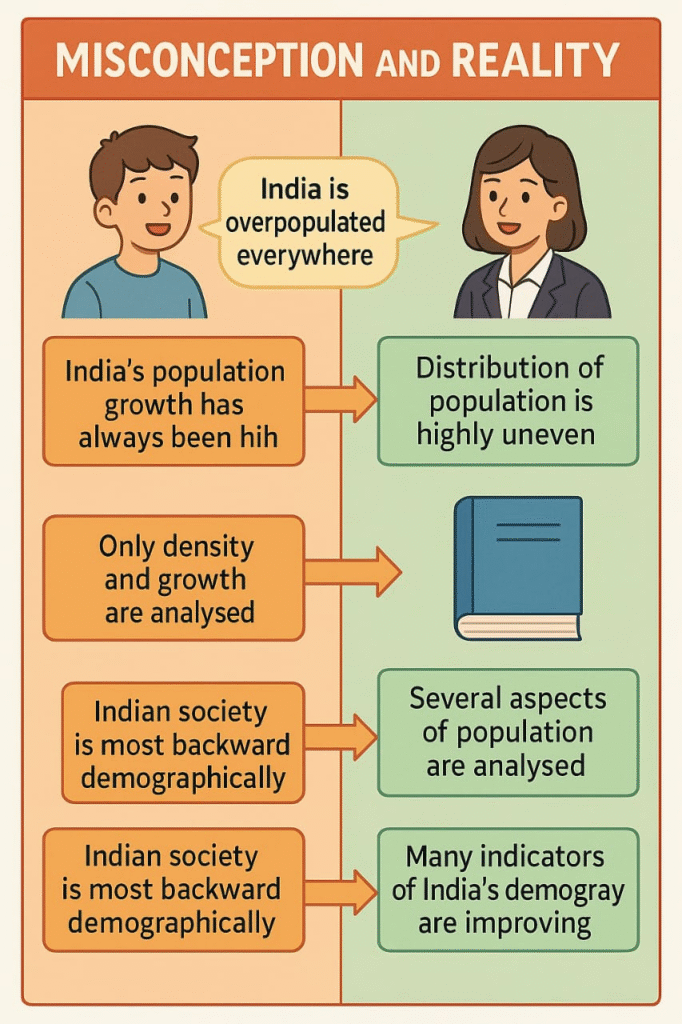
MISCONCEPTIONS “ALERTS”
————————————————————————————————————————————————————————————————————————————
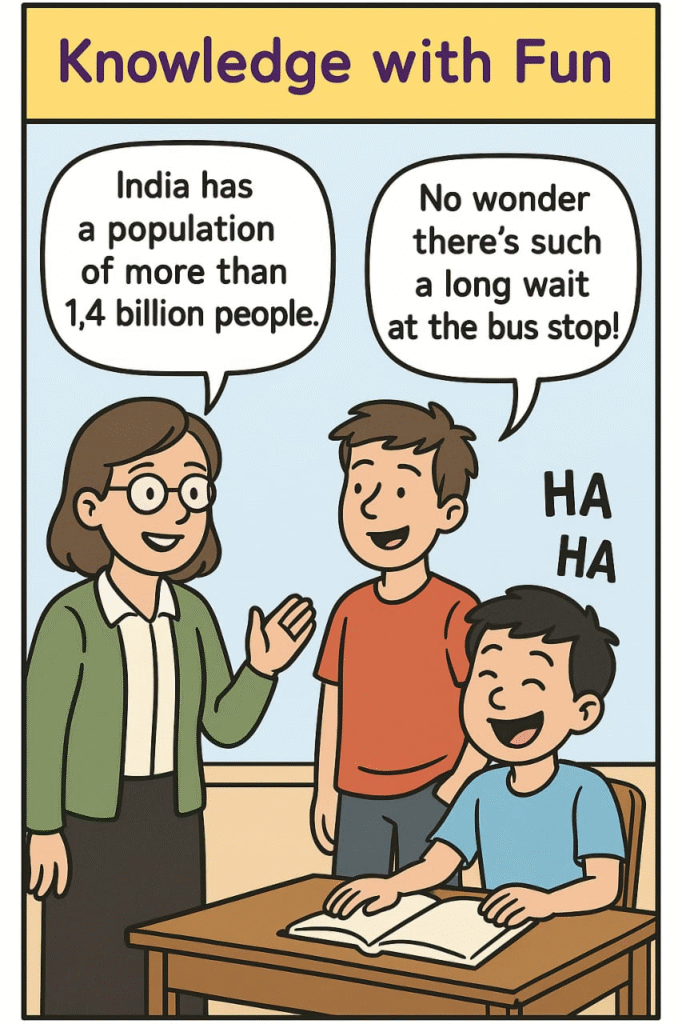
KNOWLEDGE WITH FUN
————————————————————————————————————————————————————————————————————————————
MNEMONICS
————————————————————————————————————————————————————————————————————————————